Results and data monetary accounts

Environmentally related transfers

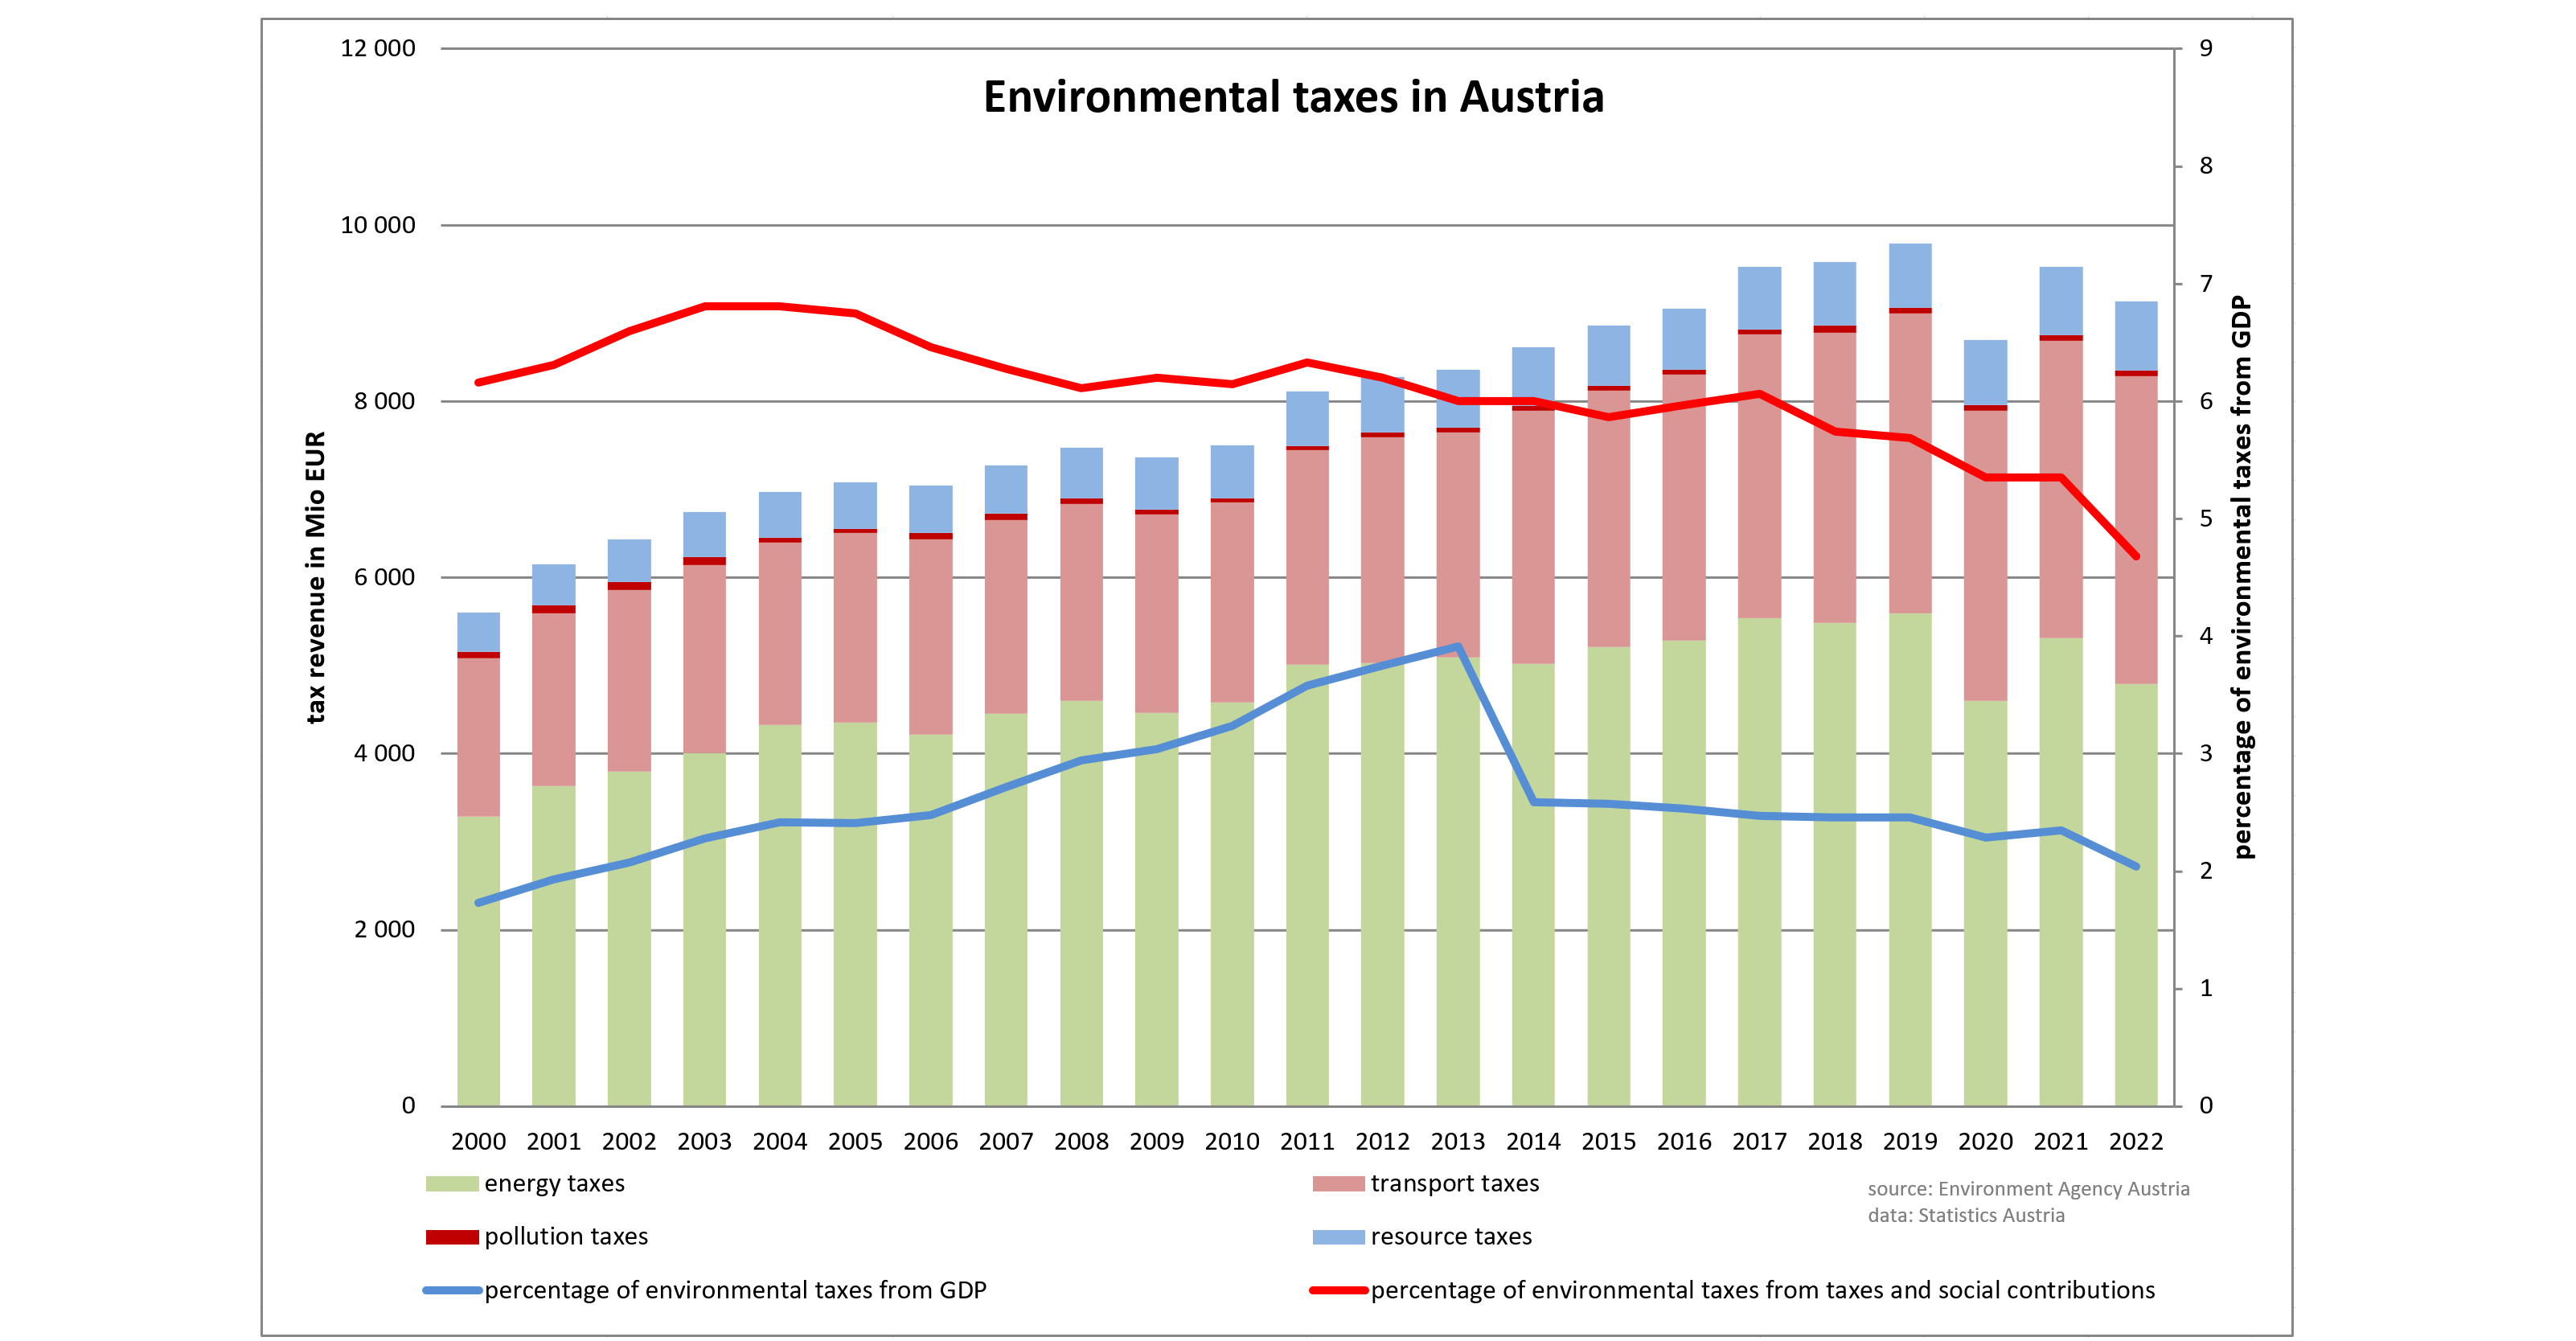
Environmental taxes in Austria 2000 - 2023

Energy and transport taxes make up the largest share of environmental taxes in Austria. Overall, the absolute figures for eco-taxes showed a continuous increase between 2000 and 2019. Since 2020, however, the trend for eco-taxes has not been linear. The comparatively low energy tax figures for the years 2020 to 2022 can be attributed, for example, to lower energy consumption during the COVID-19 pandemic or energy-saving measures implemented in response to the conflict in Ukraine. The share of eco-taxes in GDP remained relatively stable at around 2.5 % in the years prior to the COVID-19 pandemic. Since 2020, this share has declined and is currently just under 2 % in 2023. The share of eco-taxes in other taxes and social contributions, after a brief increase in 2017 (6.1%), has fallen continuously to around 4.9% in 2023.

Download Chart (.pdf)

Download Chart (.png)

Download Data (.xls)

Environmental protection expenditures

Environmental protection expenditures in Austria 1995 - 2021

The diagram describes the results from the environmental protection expenditures accounts for the period 1995 to 2021. Overall, environmental protection expenditures in Austria in 2021 amounted to around 14.6 billion euros. This corresponds to an increase in annual environmental protection expenditures of around 141 % compared to 1995. In the shorter observation period from 2010, the increase in annual environmental protection expenditures compared to 2021 is around 30 %. The largest increase, at around 50 %, can be seen in the area of ​​waste management, followed by the area of ​​protection and remediation of soil, groundwater and surface water with around 18%. Annual environmental protection expenditures for other environmental protection activities decreased between 2010 and 2021, namely by around 252 million euros when comparing these two years.

Download Chart (.pdf)

Download Chart (.png)

Download Data (.xls)